
Data experts and IT professionals have a tough job — no matter how bad or dirty your data is, we need to come up with different ways to make your data consumable. At First Direct Corp., we’ve worked with many different Reporting and Business Intelligence tools that allow the most complicated data sets to be visualized in the most simplest of ways.
This article will focus on using Google Charts and WAMP to create simple, interactive charts and data grids of your GoldMine (SQL Server) data.
What is Google Charts?
Google Charts is a FREE purely JavaScript based charting library meant to enhance web applications by adding interactive charting capability. Google Charts enables you to create a wide variety of charts based on your data. For example, line charts, spline charts, area charts, bar charts, column charts, pie charts, geo charts and so many others.
What is WAMP?
WAMP is sometimes used as an abbreviated name for the software stack Windows, Apache, MySQL, PHP. It is derived from LAMP which stands for Linux, Apache, MySQL, and PHP. As the name implies, while LAMP is used on Linux servers, WAMP is used on Windows servers.
The “A” in WAMP stands for Apache. Apache is server software that is used to serve webpages. Whenever someone types in your website’s URL, Apache is usually the software that “serves” your web site.
The “M” in WAMP stands for MySQL. MySQL is a database management system. It’s job in the software stack is to store all of your website’s content, user profiles, comments, etc. For this article we won’t be using MySQL because your GoldMine database information is stored/hosted in a MS SQL Server database. So we’ll be using MS SQL Server vs MySQL.
The “P” in WAMP stands for PHP. PHP is the programming language that many websites are written in, for example Facebook.com is developed/written using PHP. It is also the piece that holds the entire software stack together. It runs as a process in Apache and communicates with the MySQL or SQL Server database to dynamically build and display your web pages.
WAMP software stack can be downloaded from wampserver project’s download page. For Microsoft windows users, it comes in an easy installation package (installation tutorial video) with a control panel. Launching the WAMP manager control panel starts Apache, PHP and MySQL web services on the local computer it is installed on. WAMP and other software stacks with similar names and features are a good way to develop websites on a local machine without transferring the files to a live website or web hosting account.
Creating Your First Google Charts (Pie Chart)
Once WAMP is installed and running you are now ready to start creating/building your first php application. For this articles purposes we will create a simple Google Charts Pie Chart based on your recently completed activities (calls, appts, next actions) in your GoldMine database (SQL Server). You will need to know the following information in order to connect to your SQL Server database.
- SQL Servername = Your SQL Server name, this is usually available in GoldMine under Tools >> Database >> Alias Manager
- SQL Userid = This is the SQL Server login username, if you are not sure of what this is, contact your SQL Server database admin.
- SQL Password = This is the SQL Server login password, again ask your SQL Server database admin.
- SQL/GoldMine Database name = This is the GoldMine database (SQL Database name), found in Tools >> Database >> Alias Manager
Once you have this information, copy the following PHP and HTML code below to a notepad document and update the first 4 lines with your SQL Server login information as well as the tSQL query below it and replace YOUR GOLDMINE USERNAME with your actual GoldMine login username. Then save this notepad file as “mychart.php” in the www directory of your WAMP installation folder. Usually C:/WAMP/www
<?php

$ServerName = "yourservername";
$UID = "yourSQLusername";
$PWD = "yourSQLpassword";
$DatabaseName = "goldminedatabasename";

$connectionInfo = array( "UID"=>$UID, "PWD"=>$PWD, "Database"=>$DatabaseName);

/* Connect using SQL Server Authentication. */
$conn = sqlsrv_connect( $ServerName, $connectionInfo);

/*  Todays date - 1 day, change the 1 to another number to select a date further back.*/
$startdate = 'getdate() - 1';

/* Todays Date */
$enddate = getdate();

$tsql = "SELECT srectype as Type, count(*) as Total
FROM  conthist
WHERE createon BETWEEN '$startdate' AND '$enddate' AND srectype IN ('C','A','T')
AND userid IN ('YOUR GOLDMINE USERNAME')
GROUP BY srectype, userid";

/* Execute the query. */

$stmt = sqlsrv_query( $conn, $tsql);

if ( !$stmt )
{
echo "Error in statement execution.\n";
die( print_r( sqlsrv_errors(), true));
}
else
{

$table = array();

$table['cols']=array(
array('label'=> 'Activity Type', type=>'string'),
array('label'=> '# Completed', type=>'number'),
);

$rows=array();
while($r=sqlsrv_fetch_array($stmt, SQLSRV_FETCH_ASSOC)){
$temp=array();
$temp[]=array('v' => $r['Type']);
$temp[]=array('v' => $r['Total']);
$rows[]=array('c' => $temp);
}

$table['rows']=$rows;

$jsonTable = json_encode($table);

/* Free statement and connection resources. */
sqlsrv_free_stmt( $stmt);
sqlsrv_close( $conn);
}
?>
<html>
  <head>
    <script type="text/javascript" src="https://www.gstatic.com/charts/loader.js"></script>
    <script type="text/javascript">
      google.charts.load('current', {'packages':['corechart']});
      google.charts.setOnLoadCallback(drawChart);

      function drawChart() {
        var data = new google.visualization.DataTable(<?=$jsonTable?>);

        var options = {
          title: 'My Completed Activities',
          is3D: true,
        };

        var chart = new google.visualization.PieChart(document.getElementById('piechart'));

        chart.draw(data, options);
      }
    </script>
  </head>
  <body>
    <div id="piechart" style="width: 900px; height: 500px;"></div>
  </body>
</html>
Once you have updated and saved the mychart.php file to your www directory you should be able to browse to it using your web browser (Google Chrome, Firefox, Internet Explorer) via http://localhost/mychart.php
You should see a pie chart similar to the following:
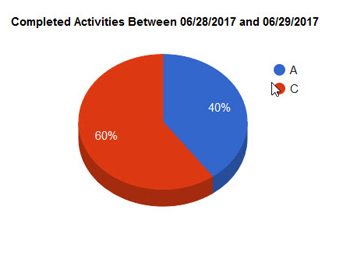
We can add as many other Google Charts as we’d like to this mychart.php web page. This Dashboard of different types of reports can then be used to analyze your GoldMine information. Pending/Calendar information, Forecasted Sales, Completed Sales, Service Center Tickets, Project information. The list goes on and on. The best part is that Google Charts and WAMP are FREE and in a matter of a few minutes, you’re ready to start developing/building your web based dashboards. You can even grant other users on your network access to these web pages/charts.
If you’d like help with creating your own Google Charts and Data Grids, please contact First Direct Corp. today .

Request more info: