Digital Dashboards, also known as Business Intelligence (BI) Dashboards, Enterprise Dashboards, or Executive Dashboards, are visually-based summaries of business data that show at-a-glance as a roll-up of business conditions through metrics and Key Performance Indicators (KPIs). Digital Dashboards have become a very popular BI tool that has arisen in the last few years because of the understanding they can quickly convey to management and others.
You can think of a Digital Dashboard as a graphic summary of some aspect of your data, potentially with the ability to drill down into the component data. For example, a chart of certain sales activities by sales person.
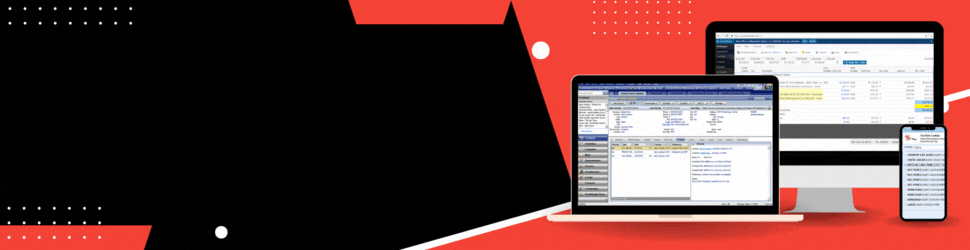
GoldMine Premium and Corporate editions both operate on a Microsoft SQL Database which includes MS SQL Server Reporting Services (SSRS), a server-based report generation software system from Microsoft that can produce Digital Dashboards. Because Digital Dashboards can be accessed via a web interface, they can be viewed from most any Internet Browser, as well as right within the GoldMine GM+ Views or GM+ Browser.
This all sounds rather complicated and, technically, it certainly does require skills. But from a user perspective the concept is simple and easy. Digital Dashboards will give GoldMine users a fast and friendly way to get information on activity in your GoldMine database, or any accessible SQL database for that matter.
Digital Dashboards accessed from your GM+ Views or GM+ Browser can help your company to work smart and efficiently. Putting these highly intuitive and expressive sources of information at the fingertips of your organization is going to increase the ROI of your CRM and go a longer way toward garnering greater usage.
For the report developers out there I’ll describe what it is like to create digital dashboards and reports using SQL Reporting Services. First, when MS-SQL Server 2005 is installed it will give you the option to install Reporting Services. The RS designer installs as a snap-in to Visual Studio .NET. If you do not already have VS .NET installed that’s ok because the RS Designer will run as a standalone application. There are three major steps to building a report: query, layout, and deployment.
In step 1 you build a SQL query by selecting a datasource and then using the Query Builder (Figure 1) to select the fields and tables for your report. Then you are presented with a wizard (Figure 2) that will bring you to step 2, allowing you to set the major aspects of the report’s layout. Here you select what fields to group on, whether you want totals to appear, and select which fields you want to see in your details section. After going through this wizard you will then be brought to the actual layout view (Figure 3) and it is here where you will fine-tune your report. The best way I can describe this part of the interface is it is a cross between a traditional report designer like Crystal Reports and an Excel spreadsheet with a bunch of formulas. Although the wizard will take care of a lot of the grunt work for you, be prepared to roll up your sleeves and write some formulas in order to get the report to be the finished product you are looking for. Once you get the report looking how you want, it is time for step 3 – deployment. To deploy your report all you have to do is specify the web server address and folder that is to be the destination for your report and simply run the “Deploy” option from the main menu, that’s it. All your users need to view your new report is a web browser.
So those are the major steps to building your report. And a digital dashboard is really just a single report comprised of smaller reports all arranged on a single page (Figure 4).
Figure 1. Query Builder |
Figure 2. Report Wizard Layout |
Figure 3. Layout Fine-Tuning |
Figure 4 – Dashboard made of several smaller reports |
Digital Dashboards, are essentially just graphical reports which can offer the ability to drill down for details. They are very popular now because they provide businesses with a highly visually and intuitive take on data. Because they allow the viewer to access the dashboard from their Internet browser, it offers decision makers a very quick way to gain understanding and insight. In essence, dashboards a great tool for managing smarter!
If you’d like to see a demonstration of Digital Dashboard or if you need help putting this idea to use, First Direct Corp. is here to help you. Call (845) 221-3800 or email info@1stdirect.com to request assistance!